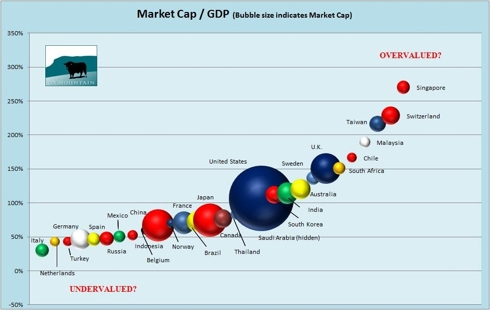
ก็เลยลองสรุปข้อมูล ทำเป็นตารางเปรียบเทียบระหว่าง มาร์เก็ตแคบ / GDP ครับ เผื่อจะเป็นประโยชน์ กับทุกๆท่าน
ผิดถูก/คลาดเคลื่อนประการใด ขออภัยมา ณ ที่นี้ด้วย


3. Market Valuations
Over the long run, stock market valuation reverts to its mean. A higher current valuation certainly correlates with lower long-term returns in the future. On the other hand, a lower current valuation level correlates with a higher long-term return. The total market valuation is measured by the ratio of total market cap (TMC) to GNP -- the equation representing Warren Buffett's "best single measure". This ratio since 1970 is shown in the second chart to the right. Gurufocus.com calculates and updates this ratio daily. As of 04/08/2011, this ratio is 96.9%.
We can see that, during the past four decades, the TMC/GNP ratio has varied within a very wide range. The lowest point was about 35% in the previous deep recession of 1982, while the highest point was 148% during the tech bubble in 2000. The market went from extremely undervalued in 1982 to extremely overvalued in 2000.
Based on these historical valuations, we have divided market valuation into five zones:
Ratio = Total Market Cap / GDP Valuation
Ratio < 50% Significantly Undervalued
50% < Ratio < 75% Modestly Undervalued
75% < Ratio < 90% Fair Valued
90% < Ratio < 115% Modestly Overvalued
Ratio > 115% Significantly Overvalued
Where are we today (04/08/2011)? Ratio = 96.9%, Modestly Overvalued
The Sources of Investment Returns


จะว่าอย่างนั้นก็ไม่ถูกซะทีเดียวครับPaul Octopus เขียน:อ่านครั้งแรกคิดว่า Logically ไม่น่าจะอยู่ในระดับนั้นได้ บริษัท 400 กว่าๆมีมูลค่าเท่าประเทศไทย มัน Bubble รึเปล่า

หัก import ก็ถูกต้องแล้วครับ เพราะไทยก็ import มาเพื่อผลิตแล้ว export เยอะนะครับ คนส่วนใหญ่ก็ใช้น้ำมัน ทุกคนใช้ไฟฟ้า ซึ่งก็นำเข้ามานะครับKriangL เขียน:อีกอย่างนึง GDP เขาเอามูลค่า import มาหัก คนส่วนใหญ่ใช้ของในประเทศกับซื้อของนำเข้า โอกาส export งานของตัวเองน้อยครับ

Paul Octopus เขียน:อ้าวน้องโจ กับ คุณ โอ ก็มา Share ด้วยเหรอครับ
ผมไม่ทันเห็น
ขอบคุณครับ ที่ Share
เพิ่มเติม นะครับ กรณี สิงคโปร์ หรือไต้หวัน ที่ Market cap / GDP สูงมาก ทั้งๆที่เป็นประเทศเล็ก นั้นอาจจะมาจาก เน้นการส่งออก (ไต้หวัน) หรือ บริษัท ที่ลิส ในตลาดนั้นๆ เป้นพวก โฮลดิ้ง ซึ่งมีบริษัทลูก, บริษัท ร่วมทุน ในต่างประเทศ มากๆๆ (สิงคโปร์) ทำให้ผลประกอบการรวมของ บริษัทแม่ มีกำไรมหาศาล และนี่น่าจะเป้นมูลเหตุให้ Market cap / GDP สูงโอ@ เขียน:ประเทศที่ Market cap / GDP สูงๆส่วนมากเป็นประเทศที่ส่งออกเยอะเลยหนิครับ
เวลาคำนวน market cap เนี่ยมันมีผลกระทบจากยอด sale และ profit (profit x PE)
แต่ว่า GDP นับแต่มูลค่าส่วนเพิ่ม (export - import)
ดันนั้นถ้ายิ่งมีการนำเข้าส่งออกเยอะๆ market cap ก็น่าจะต้องสูงกว่า GDP ในสัดส่วนที่มาก
กำไรจากบ.ลูกไหลเข้าประเทศ รายได้เข้า GDP มากCHOOKY เขียน: เพิ่มเติม นะครับ กรณี สิงคโปร์ หรือไต้หวัน ที่ Market cap / GDP สูงมาก ทั้งๆที่เป็นประเทศเล็ก นั้นอาจจะมาจาก เน้นการส่งออก (ไต้หวัน) หรือ บริษัท ที่ลิส ในตลาดนั้นๆ เป้นพวก โฮลดิ้ง ซึ่งมีบริษัทลูก, บริษัท ร่วมทุน ในต่างประเทศ มากๆๆ (สิงคโปร์) ทำให้ผลประกอบการรวมของ บริษัทแม่ มีกำไรมหาศาล และนี่น่าจะเป้นมูลเหตุให้ Market cap / GDP สูง
GDP ก็คือ earning ของทั้งประเทศ ซึ่งเท่ากับ earningของ บ.ในตลท+ ส่วนที่อยู่นอก ตลท(Market cap.+K)/GDP
K=ต้นทุนการผลิตที่อยู่นอกตลาด
เมื่อ วานผมก็คิดอยู่เหมือนกันว่าเราควรคิด GDP เป็น earning หรือ sales ของประเทศดี ตอนนี้ก็ยังคิดไม่ออกแต่คิดว่าน่าจะเป็น sales ซะมากกว่าเพราะ consumption นี่ไม่น่าจะใช่กำไรเพราะไม่หัก cost ใดๆ (หรือเปล่า)jo7393 เขียน:มาคิืดอีกที ที่ผมบอกว่าGDP ก็คือ earning ของทั้งประเทศ ซึ่งเท่ากับ earningของ บ.ในตลท+ ส่วนที่อยู่นอก ตลท(Market cap.+K)/GDP
K=ต้นทุนการผลิตที่อยู่นอกตลาด
ในเมื่อเราไม่สามารถหาค่า K (ต้นทุนการผลิตที่อยู่นอกตลาด)ได้
ทำไมเราไม่ตัด earning ส่วนที่อยู่นอก ตลท จะได้เห็นภาพชัดกว่า
ก็จะกลายเป็น Market cap/earningของบ.ในตลท
หรือพูดง่ายๆก็คือ P/E ของ SET นั่นเอง
กลายเป็น สูงสุดสู่สามัญ อะไรที่ง่ายๆพื้นๆ ใช้ดีอยู่แล้ว
หากอยากรู้ว่าภาพรวมของ SET under value หรือ bubble ก็ดู P/E ของ SET ก็เหมือนกัน นี่ครับ คิดไปคิดมากลับมาที่เิดิม
อาจจะแค่ คอนโซลิเดท งบ อย่างเดียว โดยไม่ต้องนำส่งกำไรเป็นตัวเงินจริงๆjo7393 เขียน:กำไรจากบ.ลูกไหลเข้าประเทศ รายได้เข้า GDP มากCHOOKY เขียน: เพิ่มเติม นะครับ กรณี สิงคโปร์ หรือไต้หวัน ที่ Market cap / GDP สูงมาก ทั้งๆที่เป็นประเทศเล็ก นั้นอาจจะมาจาก เน้นการส่งออก (ไต้หวัน) หรือ บริษัท ที่ลิส ในตลาดนั้นๆ เป้นพวก โฮลดิ้ง ซึ่งมีบริษัทลูก, บริษัท ร่วมทุน ในต่างประเทศ มากๆๆ (สิงคโปร์) ทำให้ผลประกอบการรวมของ บริษัทแม่ มีกำไรมหาศาล และนี่น่าจะเป้นมูลเหตุให้ Market cap / GDP สูง
ดังนั้น Market cap / GDP น่าจะต่ำไม่ใช่หรือครับ หรือผม งง เอง

Thailand Gross Domestic Product is worth 264 billion dollars or 0.43% of the world economy, according to the World Bank. From 1960 until 2009, Thailand's average Gross Domestic Product was 75.64 billion dollars reaching an historical high of 272.43 billion dollars in December of 2008 and a record low of 2.76 billion dollars in December of 1960. The economy of Thailand is an emerging economy which is heavily export-dependent, with exports accounting for more than two thirds of gross domestic product (GDP). Well-developed infrastructure, a free-enterprise economy, and generally pro-investment policies, made Thailand one of East Asia's best performers. However, overall economic growth has fallen sharply in 2008 and 2009 as global downturn and persistent political crisis stalled infrastructure mega-projects, eroded investor and consumer confidence. This page includes: Thailand Gross Domestic Product (GDP) chart, historical data and news.


Key Market Statistics and Performance (SET)
as of 08 Apr 2011
Market Cap. (M.Baht)
8,767,563.83
Turnover Ratio (YTD) (%)
31.05
P/E (times)*
14.78
P/BV (times)
2.09
Market Yield (%)
3.41